Kat Kerlin, UC Davis

Just over 9,900 wildfires burned about 4.3 million acres in 2020. That’s more than twice the previous record of acres burned in California. Yet it is about average compared to burn rates likely experienced before Euro-American settlement, according to a study from the University of California, Davis, that summarizes the 2020 fire season and examines its drivers.
The study, published in the journal Global Ecology and Biogeography, said 2020 was the first year in recorded history that burned area in California came close to rates seen before the 1800s, when an estimated 3-4 million acres burned in an average year.
Increased fire severity is the far greater concern, the study said. The authors advise that resource and fire managers working in forests shift their emphasis from reducing burned area to reducing fire severity and fire damage to people and property, and restoring key ecosystem functions after fire.
“Although burned area in 2020 was very high, it is not unprecedented if you take the longer view,” said lead author Hugh Safford, a forest and fire ecologist with the UC Davis Department of Environmental Science and Policy and chief scientist at Vibrant Planet, an environmental public benefits corporation. “The problem is that much of the burning we are seeing now is not restorative but destructive. The need to shift management goals is key, as is understanding the very important role that fuels play in driving fire severity.”

A new measure of success
California is the most fire-prone state in the United States. For the past century the key measure of success among forest managers has been decreased burned area, but that needs to change, according to the study.
Reducing burned area remains an important goal in ecosystems like chaparral and sagebrush in coastal, lowland and eastern California. In these places, frequent fires lead to ecosystem degradation and threaten human safety.
But over the past 40 years, the increases in burned area in California occurred almost entirely in central and northern California forests and woodlands rather than in southern California chaparral, which used to be the poster child for the California “fire problem.” This is even though climate warming has been more extreme in southern California.
These forests experienced a naturally high frequency of fire before fire exclusion policies in the late 19th and early 20th centuries restricted burns, including from lightning ignitions and Native American cultural burning. Fire exclusion led to a huge increase in forest density and fuels, driving an explosion in large, destructive fires.
“In these ecosystems, reducing burned area is a cause of the current catastrophic trends, not a solution to them,” the authors said.
Key 2020 wildfire statistics
The authors summarized 2020’s burning conditions, burned area and fire sizes, fire weather, fuel moisture, fatalities, property damage, suppression cost data, vegetation types, fire history and other variables from public data sources.
They found that fires in 2020 followed an accelerating, decadeslong trend of increased burn area, severity, size and costs to society and the economy.
The fires killed 33 people in 2020 with overall economic losses of more than $19 billion and firefighting costs approaching $2.1 billion. The years 2020 and 2021 together burned more area than the previous seven years combined, and only slightly less than the total burned between 1980 and 1999.
Between 2015 and 2020, total insured economic losses were more than $50 billion, and over 50,000 structures — mostly homes — were destroyed.
Air quality and wildfires
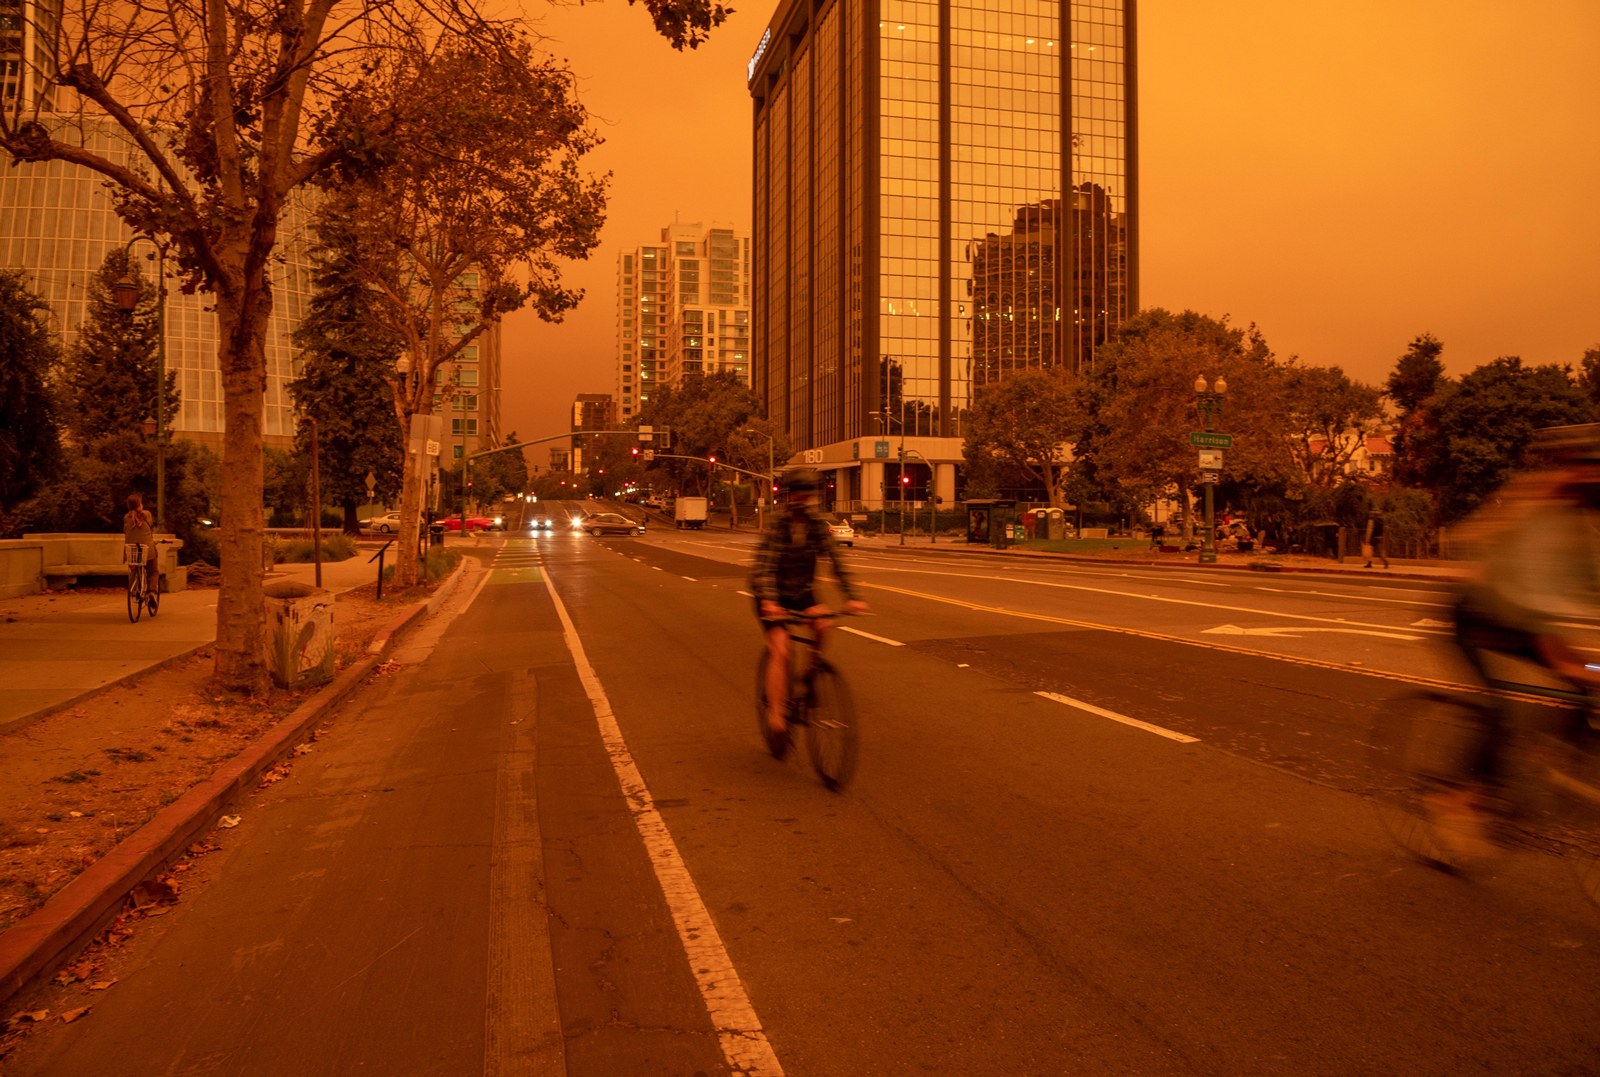
More than half of Californians experienced unhealthy, and sometimes hazardous, air quality index levels for a month or more in 2020, the study reports. The state’s worst five days of air pollution in history all occurred in 2020, according to CalFire.

Wildfire-driven air quality in August and September likely also caused 1,200 to 3,000 “excess” deaths among people age 65 or older.
The fires emitted nearly 112 million metric tons of carbon and 1.2 million tons of fine particulate matter (PM 2.5). That’s 120 times more fine particulate matter than California’s vehicles produced in the same year.
‘We can do something about this’
The study also assessed what drove fire severity patterns in 2020. Fire severity is a measure of the impact of burning on an ecosystem, measured in this study by losses in vegetation biomass.
Overall, fire severity was best explained by fuel load-related variables, with dryness and wind also playing key roles. Longer-term drought — including its effects on tree mortality before 2020 — was less important overall except in a handful of fires.
Nearly 60% of the fires were caused by humans through arson, vehicles, power lines, campfires or unknown causes, while lightning sparked the rest. However, the lightning-sparked fires burned more than five times the area burned by human-caused fires.
“Extreme weather conditions are certainly playing a role, but climate change isn’t driving all the change we’re seeing,” said Safford. “Fuel loads played a major role in driving fire severity patterns in forested landscapes in 2020, like in other years. High fuel loads are due mostly to human management decisions over the last century or more, and we can do something about this issue.”
The authors said a recent agreement between the state and U.S. Forest Service that seeks to increase fuel-reduction activities is promising, as is the recent California Wildfire and Forest Resilience Action Plan. But, they add, “there is no time to lose.”
Study co-authors include Alison Paulson of UC Davis and the USDA Forest Service, Zachary Steel of UC Berkeley, and Derek Young and Rebecca Wayman of UC Davis.

