Student financial support data tables
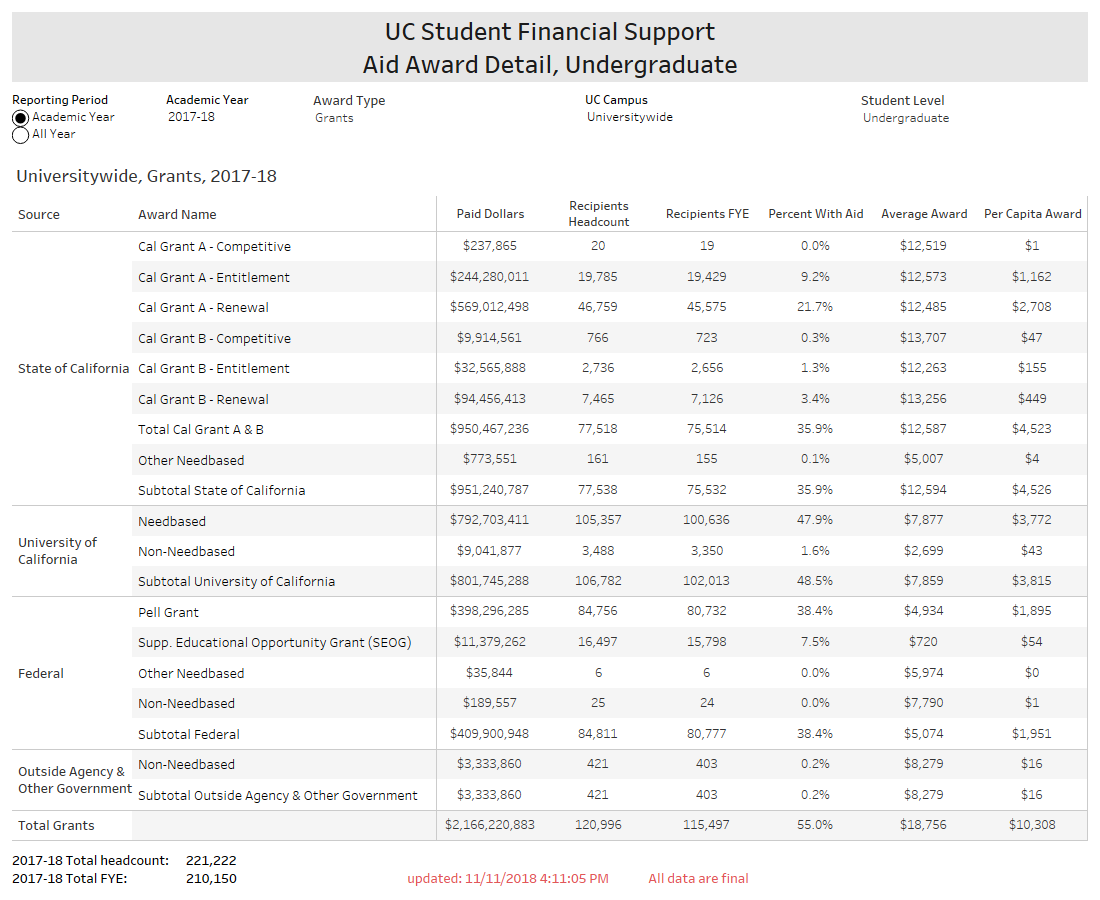
Financial aid awards to UC students by award source during the fall/winter/spring academic year and the full year including the summer term.
Undergraduate affordability
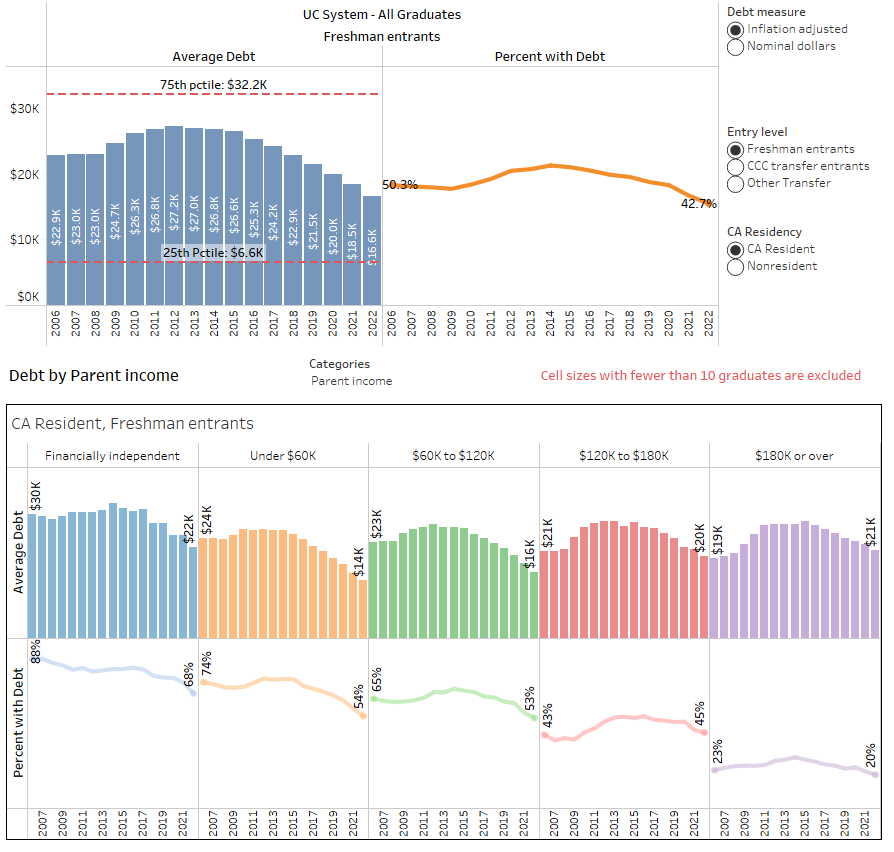
Gain knowledge of UC Undergraduate financial support, net cost of attendance, student loan debt, and cumulative debt burden at graduation for UC students.
Graduate student financial support and debt at graduation
Learn about different types of support graduate students at UC receive as well as their cumulative debt at graduation.
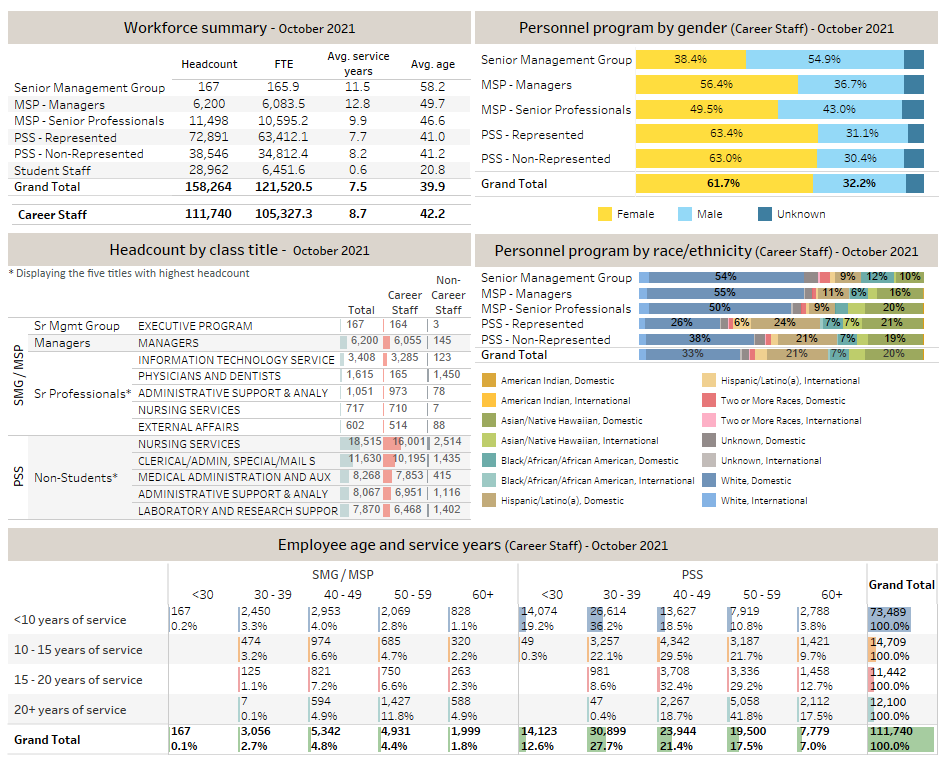
Staff workforce profile
A picture of the University of California staff workforce.
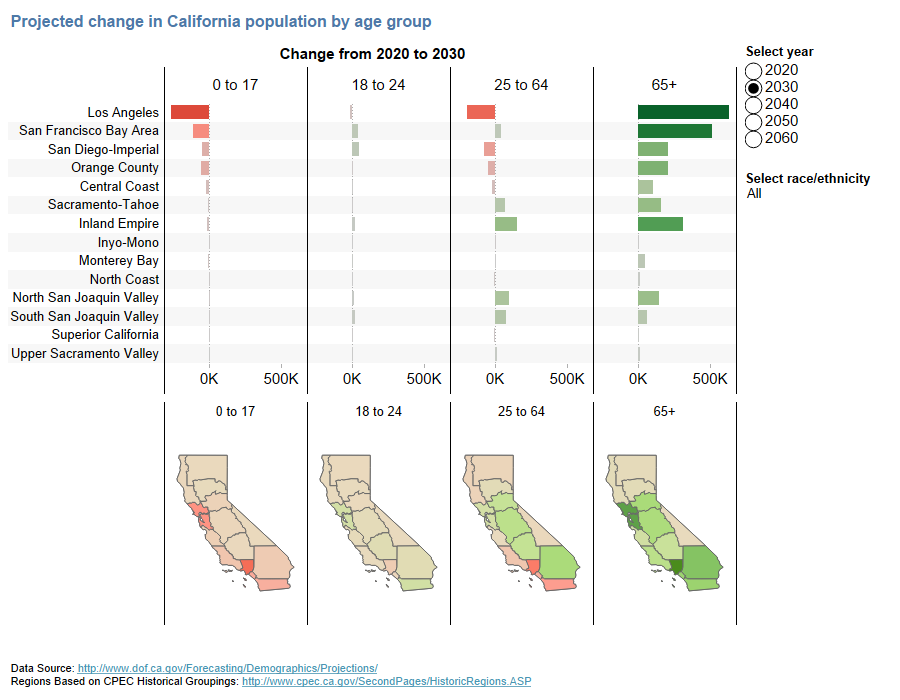
California high school graduation projections and A-G completion
What does a changing California mean for higher education?
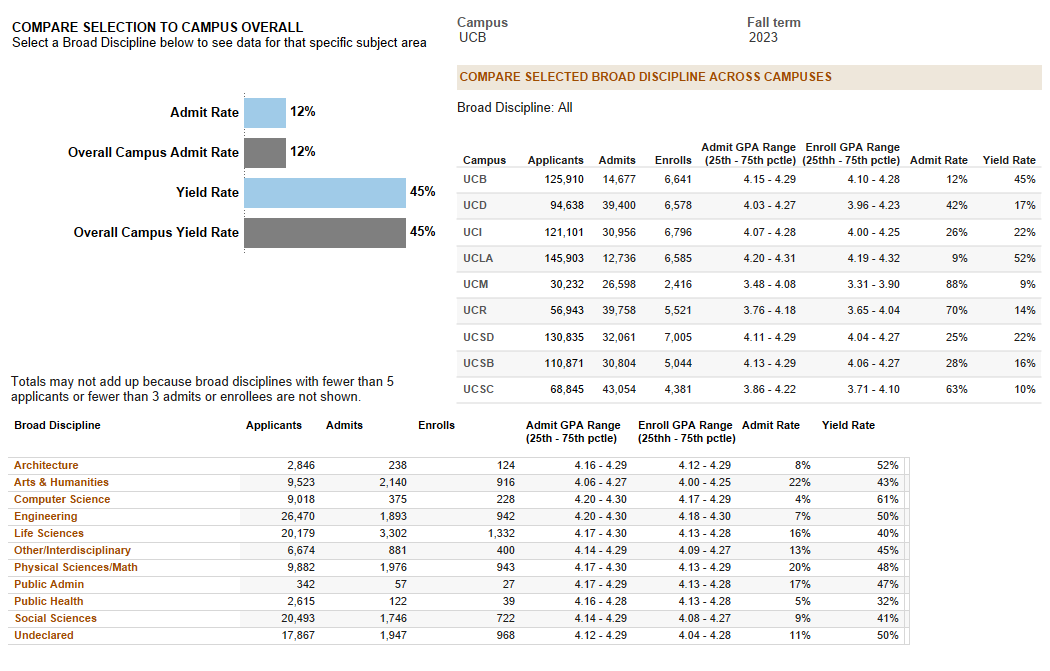
Freshman admission by discipline
GPA ranges and counts for freshman applicants by broad discipline (groupings of majors/CIP codes).
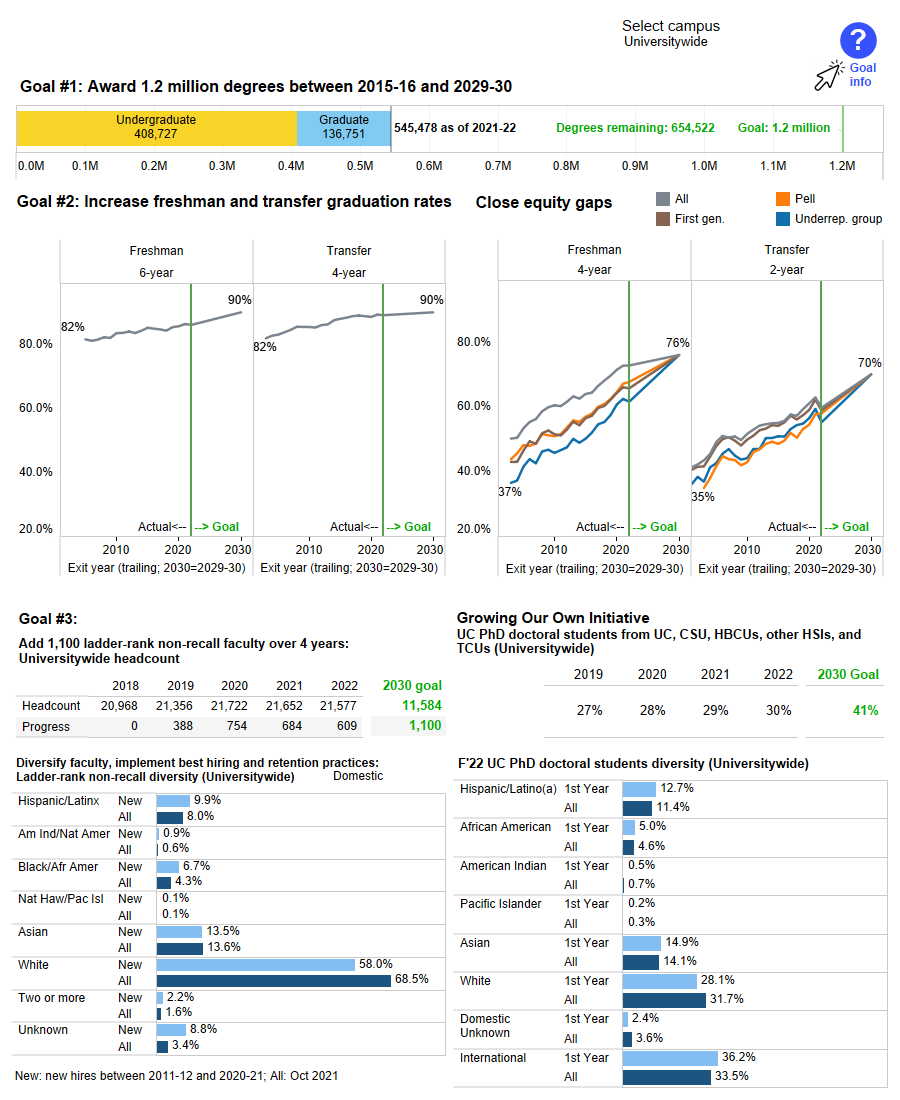
UC 2030 dashboard
This dashboard shows the UC 2030 goals in UC's multiyear framework.
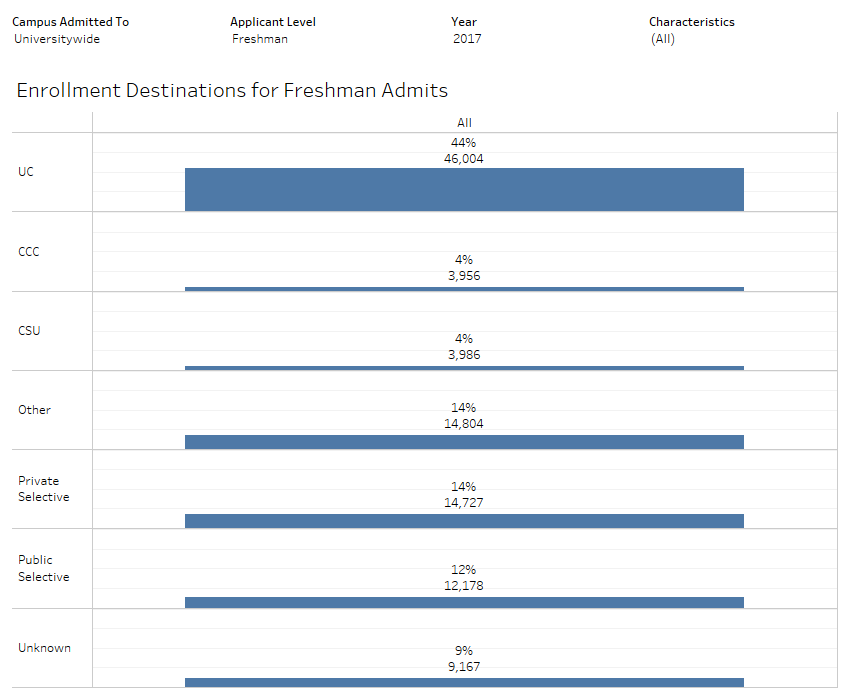
Enrollment destinations of UC admits
The types of colleges and most common specific colleges that students admitted to UC end up enrolling.
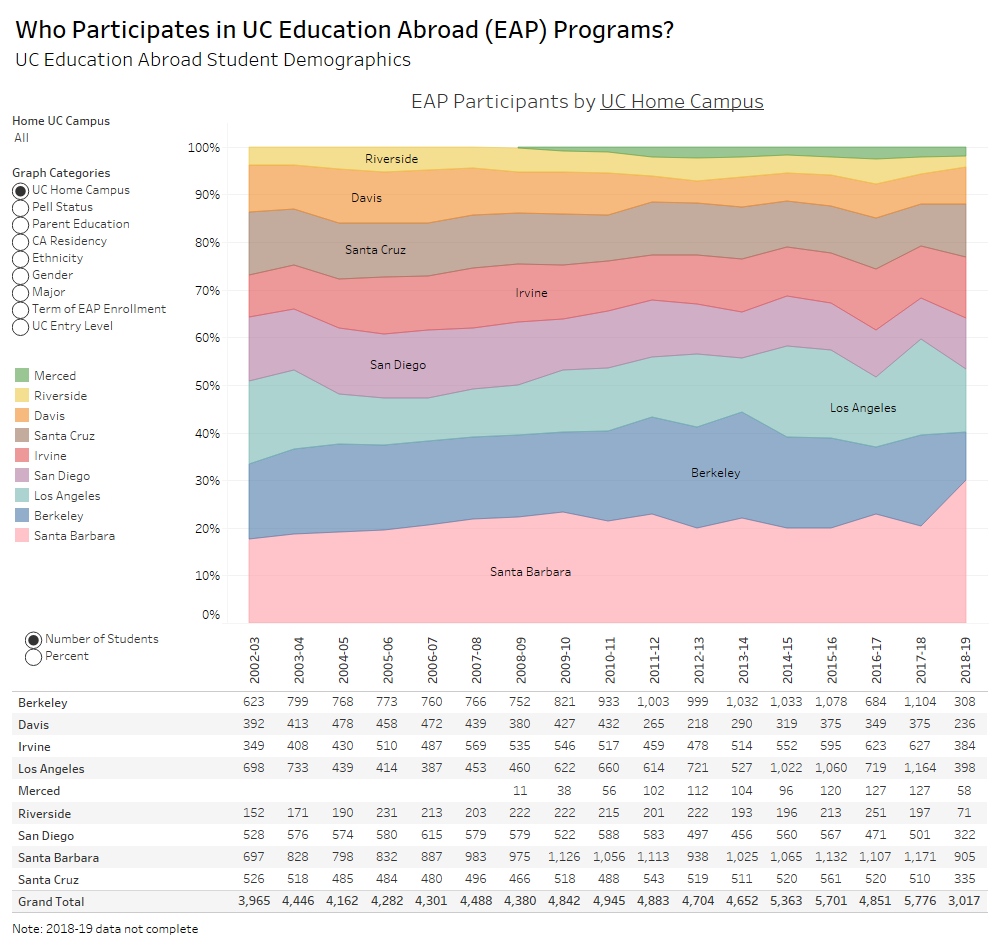
UC Education Abroad Program (EAP)
Participation of UC students in the education abroad program by campus and other demographic characteristics; earnings of education abroad participants compared to non-participants.
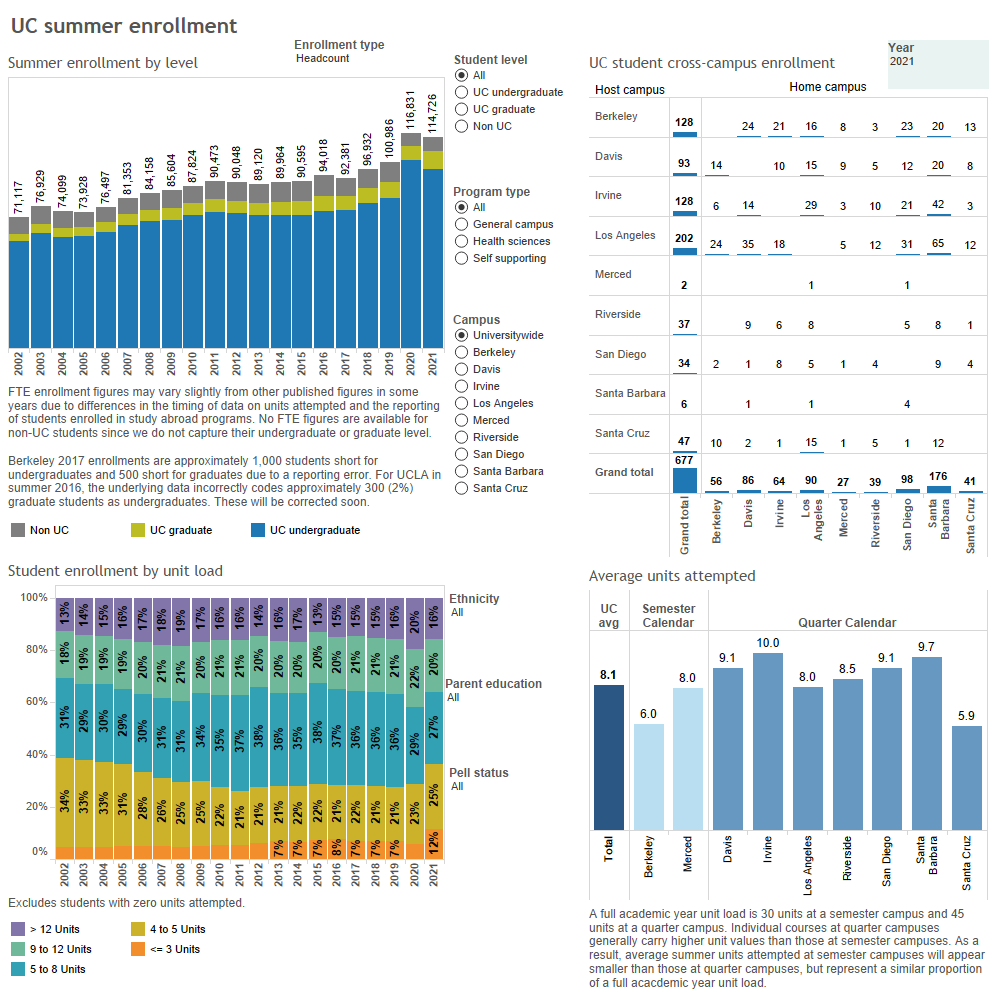
Summer enrollment
Undergraduate and graduate summer enrollment, including cross-campus enrollment and breakdown by residency and visitor status.

