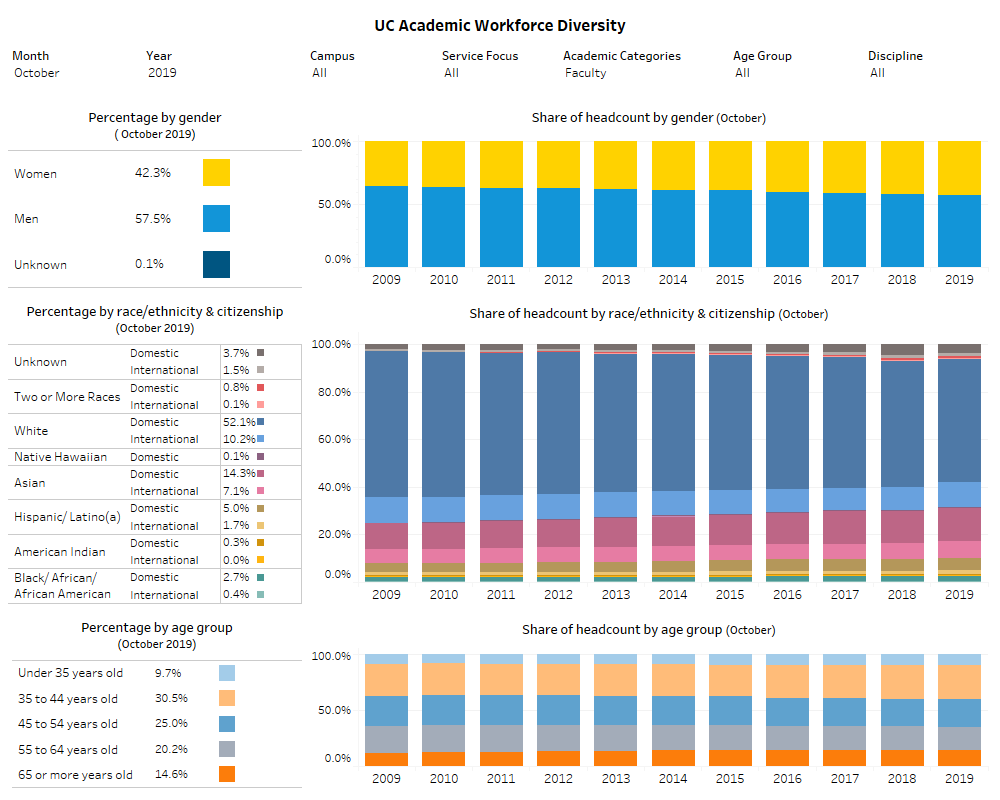
Woman on a computer working in front of a large glass window.

Information center

Explore the UC story through data

Subject

Gap analysis

Analysis of the gaps between the share of: high school graduates vs. freshman UC applicants, admits, and new enrollees and California Community College (CCC) students vs. CCC-to-UC transfer applicants, admits, and new enrollees by racial/ethnic group.

Profile of undergraduate stopouts

Explore the students who stop out without completing their bachelor’s degree at UC

UC undergraduate current and former foster youth

This dashboard offers systemwide data on UC undergraduate current and former foster youth including enrollment, demographics, majors, first-year retention and graduation rates, financial support, postgraduation outcomes, and student experience information for the UC Undergraduate Student Experience Survey.

UC military-affiliated students

This dashboard offers systemwide data on UC military-affiliated students including enrollment, demographics, majors, first-year retention and graduation rates, financial support, post-graduation outcomes, and student experience information. Military-affiliated students are defined as students who are active military, military reserve, national guard, or a military veteran.

Summer enrollment

Undergraduate and graduate summer enrollment, including cross-campus enrollment and breakdown by residency and visitor status.

First-generation college students

Systemwide data on first-generation undergraduates including enrollment, demographics, disaggregated race/ethnicity enrollment data, majors, first-year retention and graduation rates, and financial support information. First-generation college student is defined as a student where neither parent nor guardian have earned a four-year degree.

UC employee headcount

Employee headcount dashboard with October and April snapshots back to 2011.

UC employees, full-time equivalent (FTE)

FTE of personnel by category and fund source with October and April snapshots back to 2011, as well as fiscal year data.

UC 2030 dashboard

This dashboard shows the UC 2030 goals in UC's multiyear framework.

Doctoral persistence and completion

​Persistence rates and 8 and 10 year degree completion rates for students pursuing the academic doctoral degree.